Anomaly Detection
Currently in Early Access
The Anomaly Detection system is currently only exposed via the Jupiterone Early Access Program (EAP). Please contact your Solutions Architect or Account Manager to get enrolled.
Anomaly Detection
JupiterOne provides out-of-the-box Anomaly Detection powered by advanced machine learning and data analytics. It assesses all of the Device entities to proactively identify Device entities that do not conform to established patterns in an account's Asset Inventory. Once identified, these entities can be understood, triaged, and any associated risks, mitigated. In the future, JupiterOne will expand this offering to provide anomaly detection on other entity classes and types.
Data Model
The JupiterOne Anomaly Detection Assessment for Device data will create the following entities in the JupiterOne graph based on it's overall Assessment findings. It will attach anomaly data to the _type unified_device when it finds that a Device is an anomaly.
Entities
| Resource | Entity _type | Entity _class |
|---|---|---|
| Overall Anomaly Detection Assessment | anomaly_detection_assessment | Assessment |
| Device Anomaly | device_anomaly | Finding |
Relationships
Source Entity _type | Relationship _class | Target Entity _type |
|---|---|---|
anomaly_detection_assessment | IDENTIFIED | device_anomaly |
unified_device | HAS | device_anomaly |
Data used in Anomaly Detection
Just like context is key to evaluating your asset landscape, context is key to finding real anomalies in any dataset. JupiterOne combines the raw properties of an entity with properties computed from the overall graph context of an account. This allows more granular, targeted anomaly detection based on connections as well as raw property data. The tables below break down the properties (both raw and computed) that are used for anomaly detection. This is not an exhaustive list, but meant to illustrate the types of data being used.
Raw Properties
These are properties that exist on each device entity itself. These are usually provided by integrations themselves.
| Property | Type | Description |
|---|---|---|
associatedEmailAddress | string | The emailAddress associated with this Device. Is a proxy for ownership |
_class | string[] | The JupiterOne assigned class value |
_lastSeenOn | string | When JupiterOne last saw this Device from an integration |
_type | string[] | The JupiterOne assigned type value |
encryptionStatus | boolean | Indication of if this Device is encrypted or not |
firewallEnabled | boolean | Indication of if this Device has a firewall enabled or not |
ipAddress | string | The IP Address of this Device |
macAddress | string | The MAC Address of this Device |
osType | string | The Operation System type for this Device |
Computed Properties
These are properties that are computed before each run of an Anomaly Detection Assessment, using an account's current JupiterOne graph.
| Property | Type | Description |
|---|---|---|
Difference of Last Seen On and Oldest Seen On | string | The difference between the last time a Device was seen, and the oldest time a device was seen. This could indicate misconfiguration for a specific integration (like a HostAgent or ConfigurationManagement tool). |
Host Agent Configuration | boolean | Does this device have a regularly checking in HostAgent connected to it? |
Number of In Relationships | number | The number of relationships that terminate with this Device |
Number of Out Relationships | number | The number of relationships that originate with this Device |
Number of Problems | number | The number of Problem entities that are connected to this Device |
Property Importance
When inspecting a specific device_anomaly in the Property Panel or in the Anomaly Detection Report, you will see a Property Importance indicator. This indicates how much a specific property contributed to the overall anomaly score for this device. If a device property had values that were more anomalous than others, it will have a higher importance value. If a device property had values that were less anomalous than others, it will have a lower importance value.
Property Formats
Bins
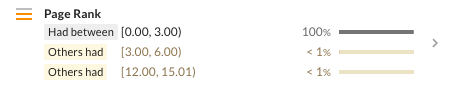
Categorizing continuous data into defined ranges helps JupiterOne better detect anomalies in your dataset. Therefore, some properties are discretely segmented into ranged bins that follow interval notation. Square brackets [ ] indicate an inclusive value, while round brackets ( ) indicate an exclusive value. For example, (1, 5] represents all numbers from 1 to 5, excluding 1 but including 5.
For example, in the screenshot below, the Page Rank property is segmented into many bins, and they all look to be exclusive on the lower bound, and inclusive on the upper.
In-App Experience
JupiterOne Anomaly Detection data is accessible via the JupiterOne application in a few places:
- Anomaly Detection Report
- Property Panel for a
device_anomalyentity - Property Panel for an
anomaly_detection_assessmententity - The
Device Anomaly Detection (Beta)Insights Dashboard - The Device Matrix (coming soon)
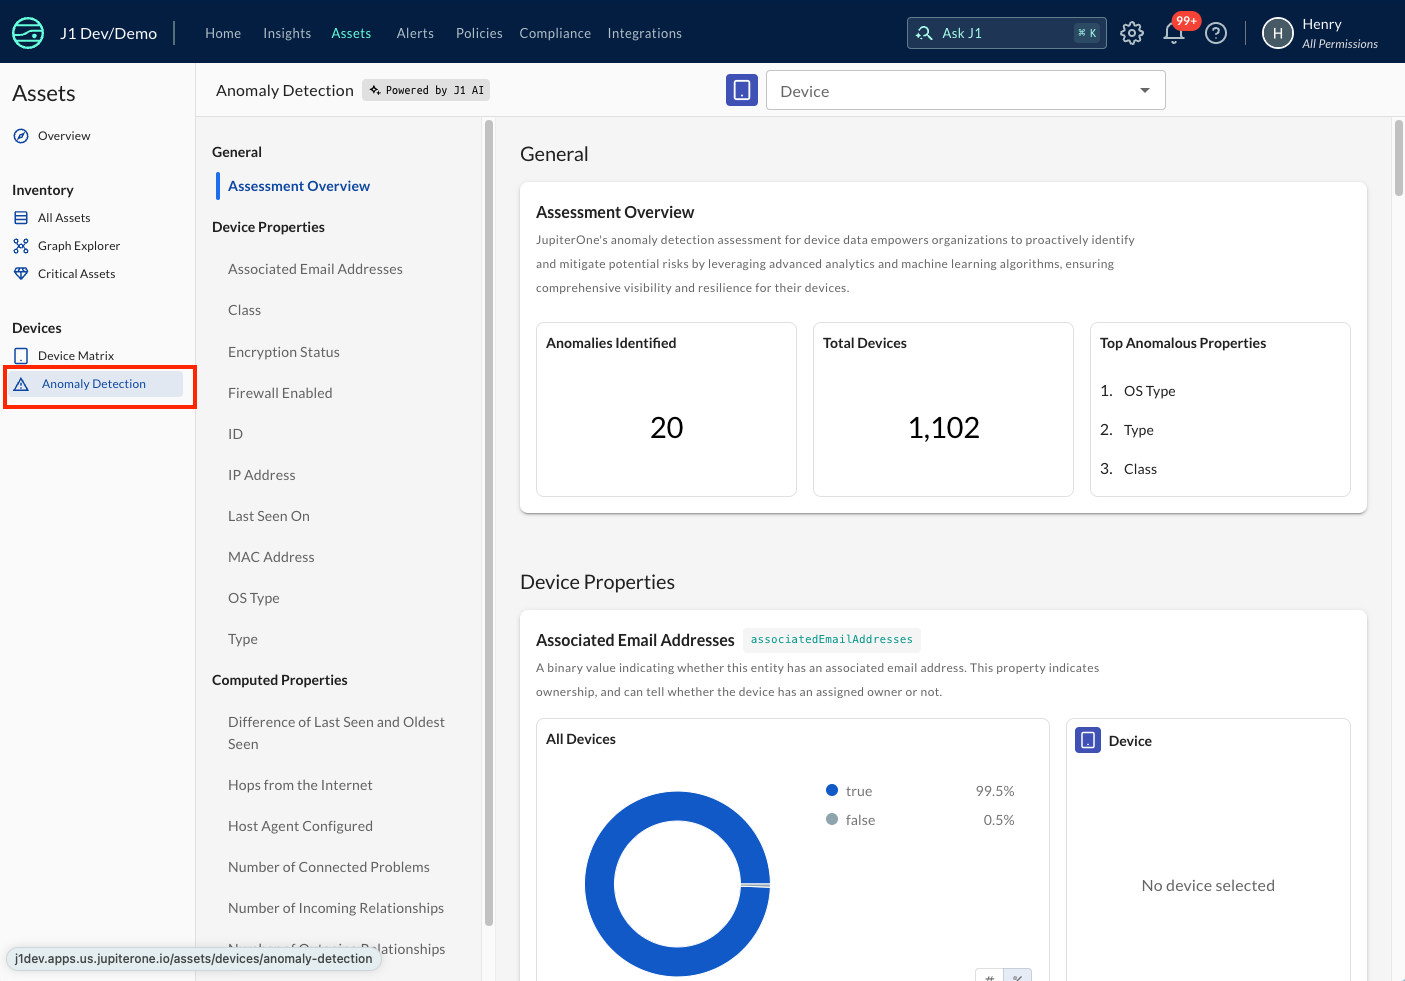
Anomaly Detection Report
The JupiterOne Anomaly Detection Report is a comprehensive overview of your device inventory, along with categorized anomalies that it contains. Currently, the Anomaly Detection Report can be launched via
- The
Anomaly Detectionnavigation item in the Assets application - The device_anomaly Property Panel
- The anomaly_detection_assessment Property Panel, or from Anomaly Detection in Assets.
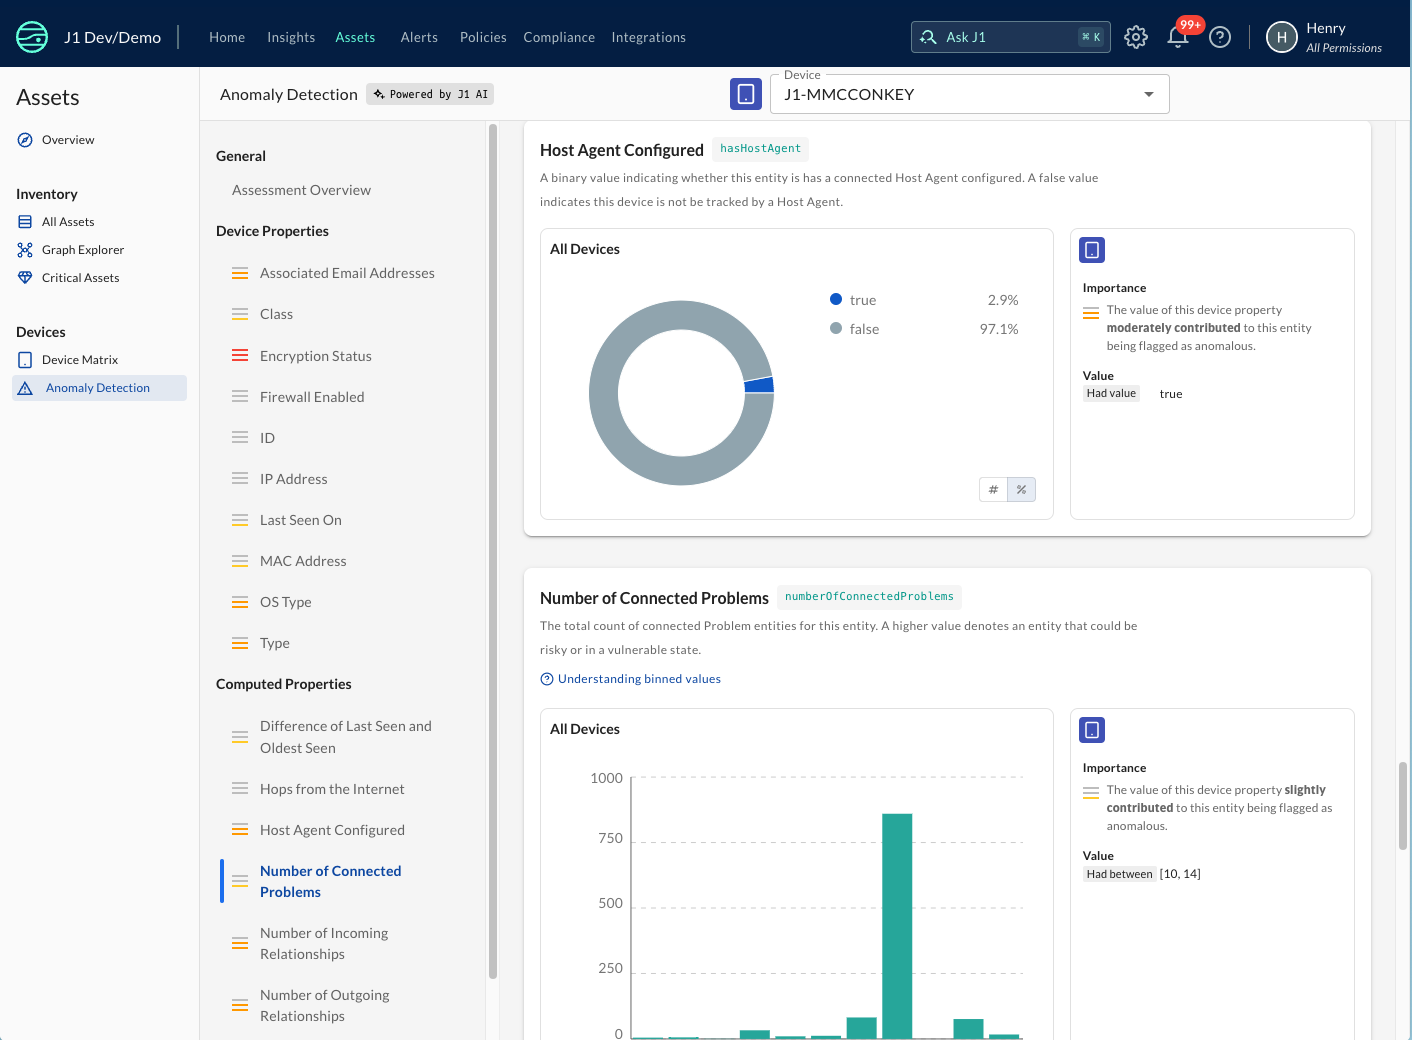
From the report, you can drill-down to a specific device using the Device selector in the report header. When selected, that Device's data will be loaded into the report, allowing you to compare it to the overall dataset (see screenshot below).
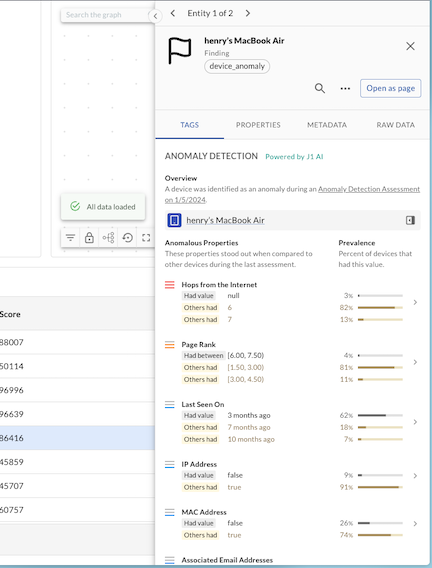
Property Panel for a device_anomaly Entity
The Property Panel for a device_anomaly entity now shows an Anomaly Detection section, and it provides
data that portrays all of the properties used by the anomaly detection model.
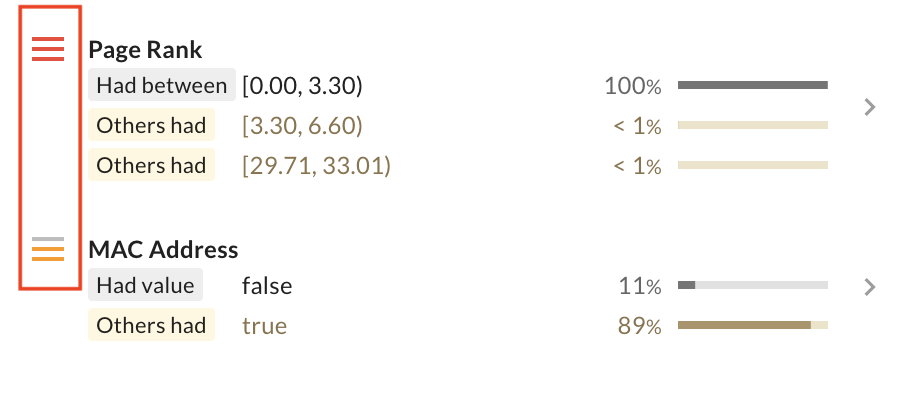
Each property contains:
- Importance - The relative sway this property had on considering this entity an anomaly. A higher value indicates the property was more anomalous.
- Value - The value for this property. In the case of a numeric or date property, the value could be "binned" with other similar values.
- Others Had Values - A few values that other entities had for this same property. These values give a quick look into the other common values for this property.
- Prevalence - The percentage of this property value across the entire device inventory.
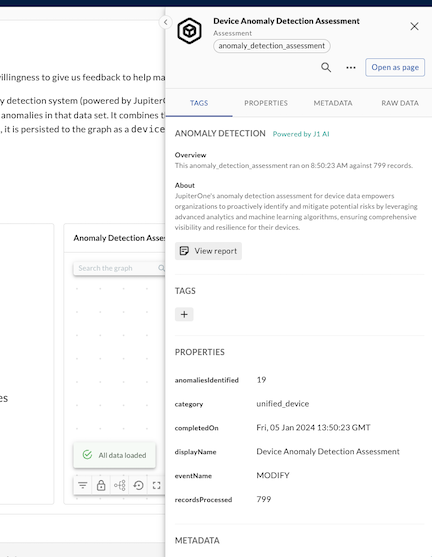
Property Panel for an anomaly_detection_assessment entity
The Property Panel for a anomaly_detection_assessment entity now shows an Anomaly Detection section, and it gives a quick overview of the Assessment run against the device inventory, along with a button to view the Anomaly Detection Report.
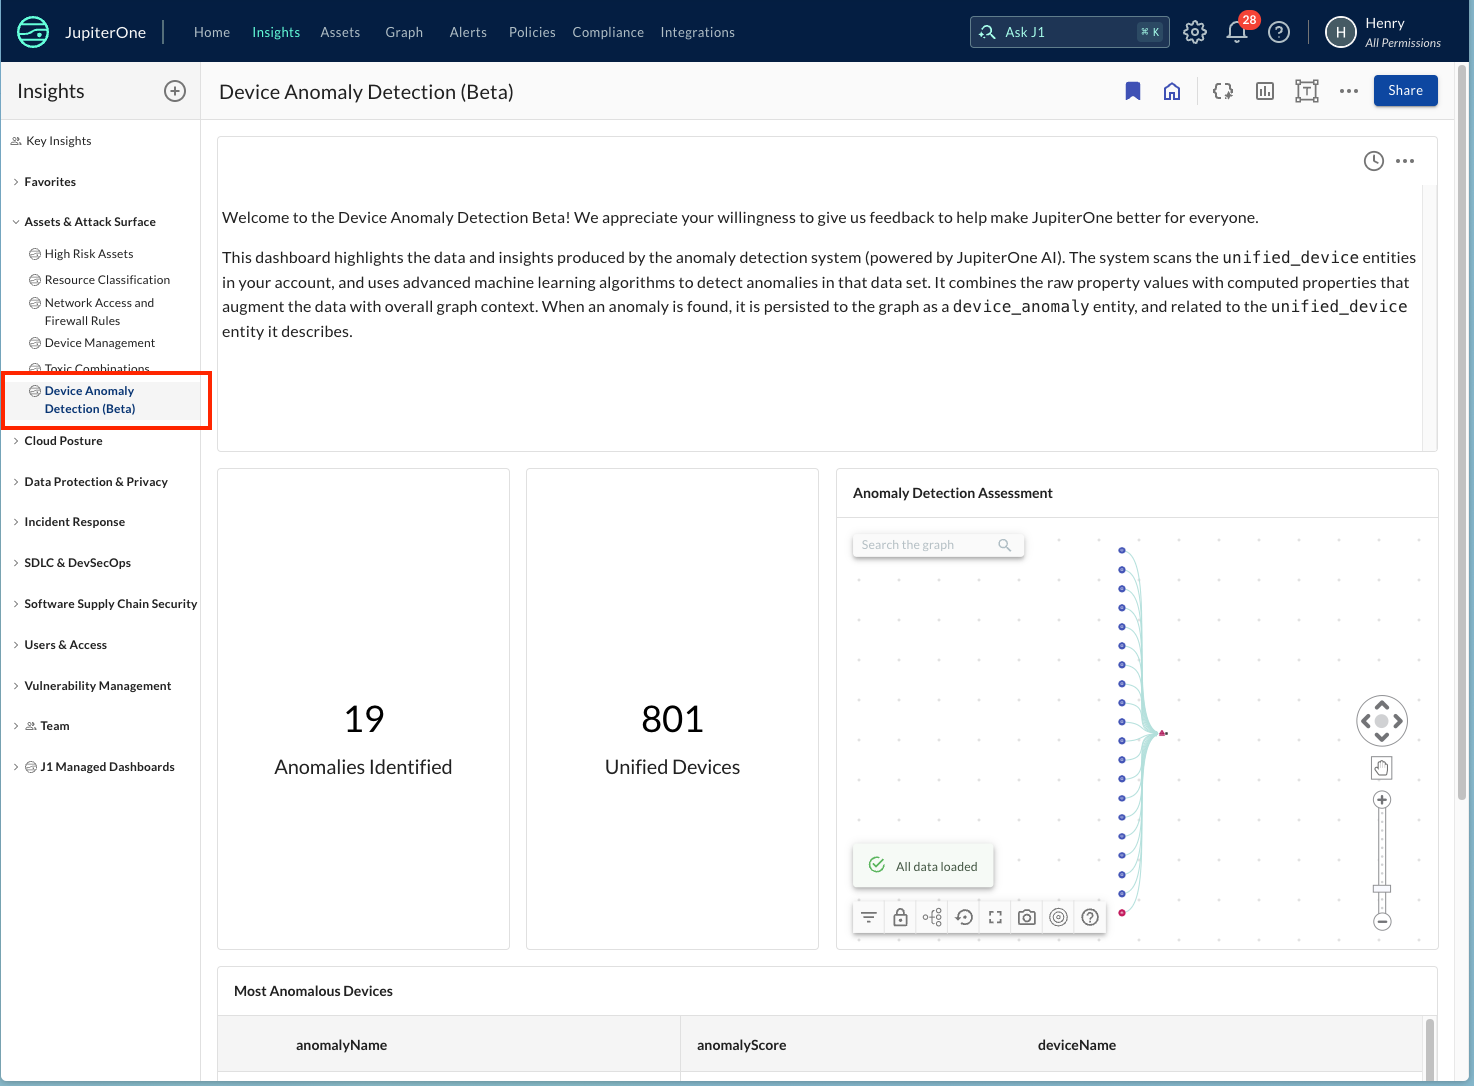
The Device Anomaly Detection (Beta) Insights Dashboard
Upon access to the Early Access Program, your account will be given access to the Device Anomaly Detection (Beta) Insights Dashboard that is a part of the Assets and Attack Surface category. This dashboard shows high level statistics about the anomalies in your account, as well as a query results table to encourage drill-downs into the data. Once this functionality is released to all customers, these widgets will be added to the Device Management Insights Dashboard.
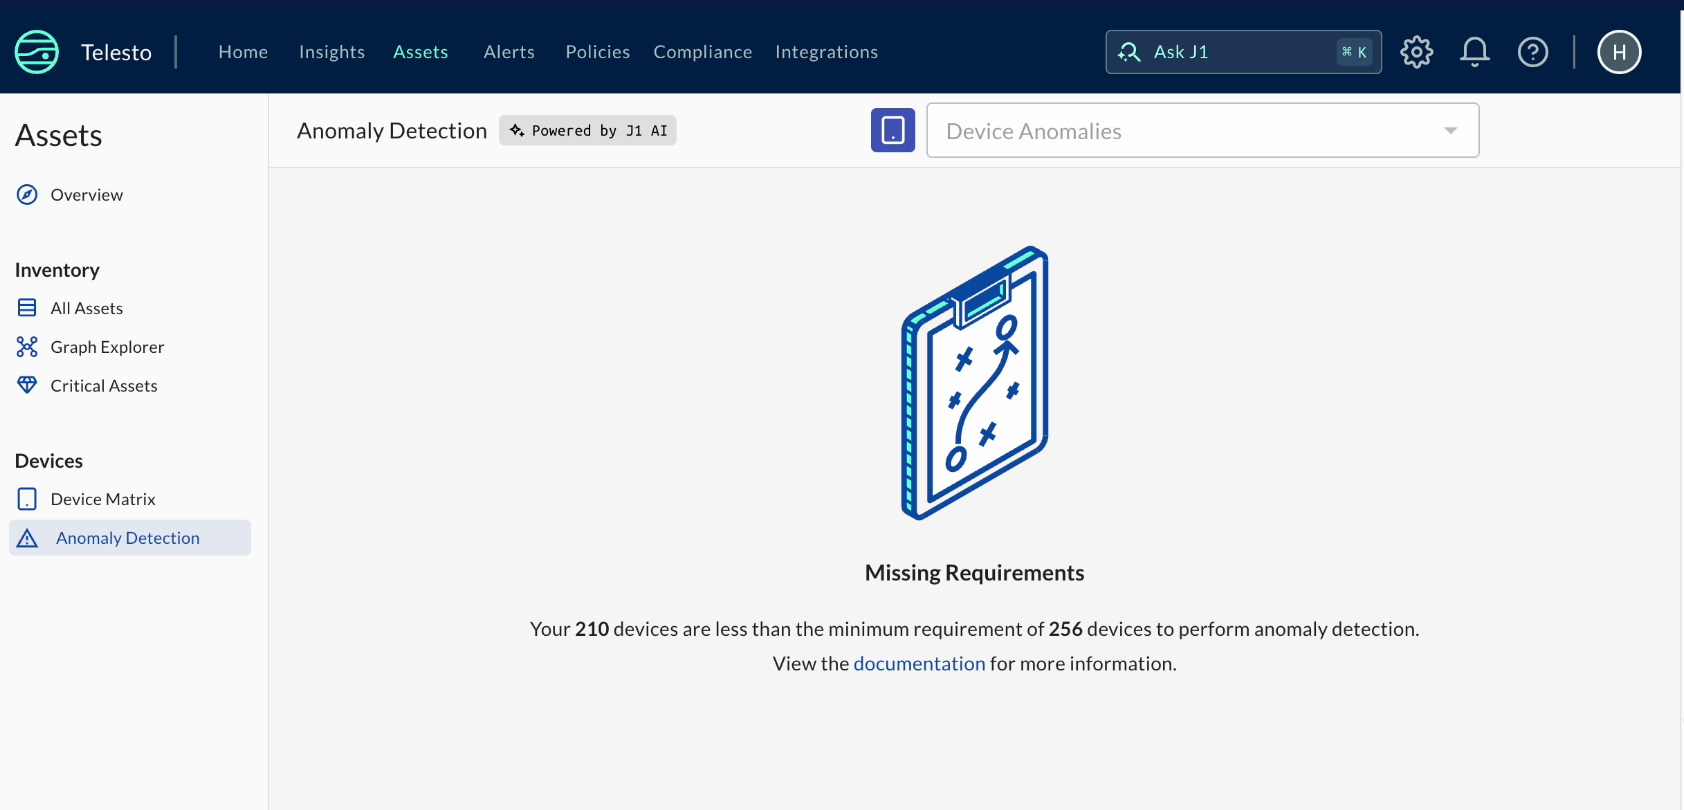
Requirements
In order to effectively predict anomalies, the machine learning model requires at least 256 rows of data. So any accounts with
less than 256 unified_device entities will not be eligible for anomaly detection. To check this, run the J1QL query:
Find unified_device RETURN count(unified_device)
If the result is less than 256, anomaly detection will not run on your account, and you will see the below screen when navigating to the anomaly detection page.
What's Next
As mentioned above, we are currently working on integrating anomaly data with the Device Matrix. In parallel, we are working to uncover other interesting data points in your JupiterOne graph in order to enhance the Anomaly Detection system and extend it to other data types.