JupiterOne Dashboard
JupiterOne Dashboard
By default, the JupiterOne workspace home page features an high-level breakdown of several data points relating to your environment. This provided view is the Dashboard Overview.
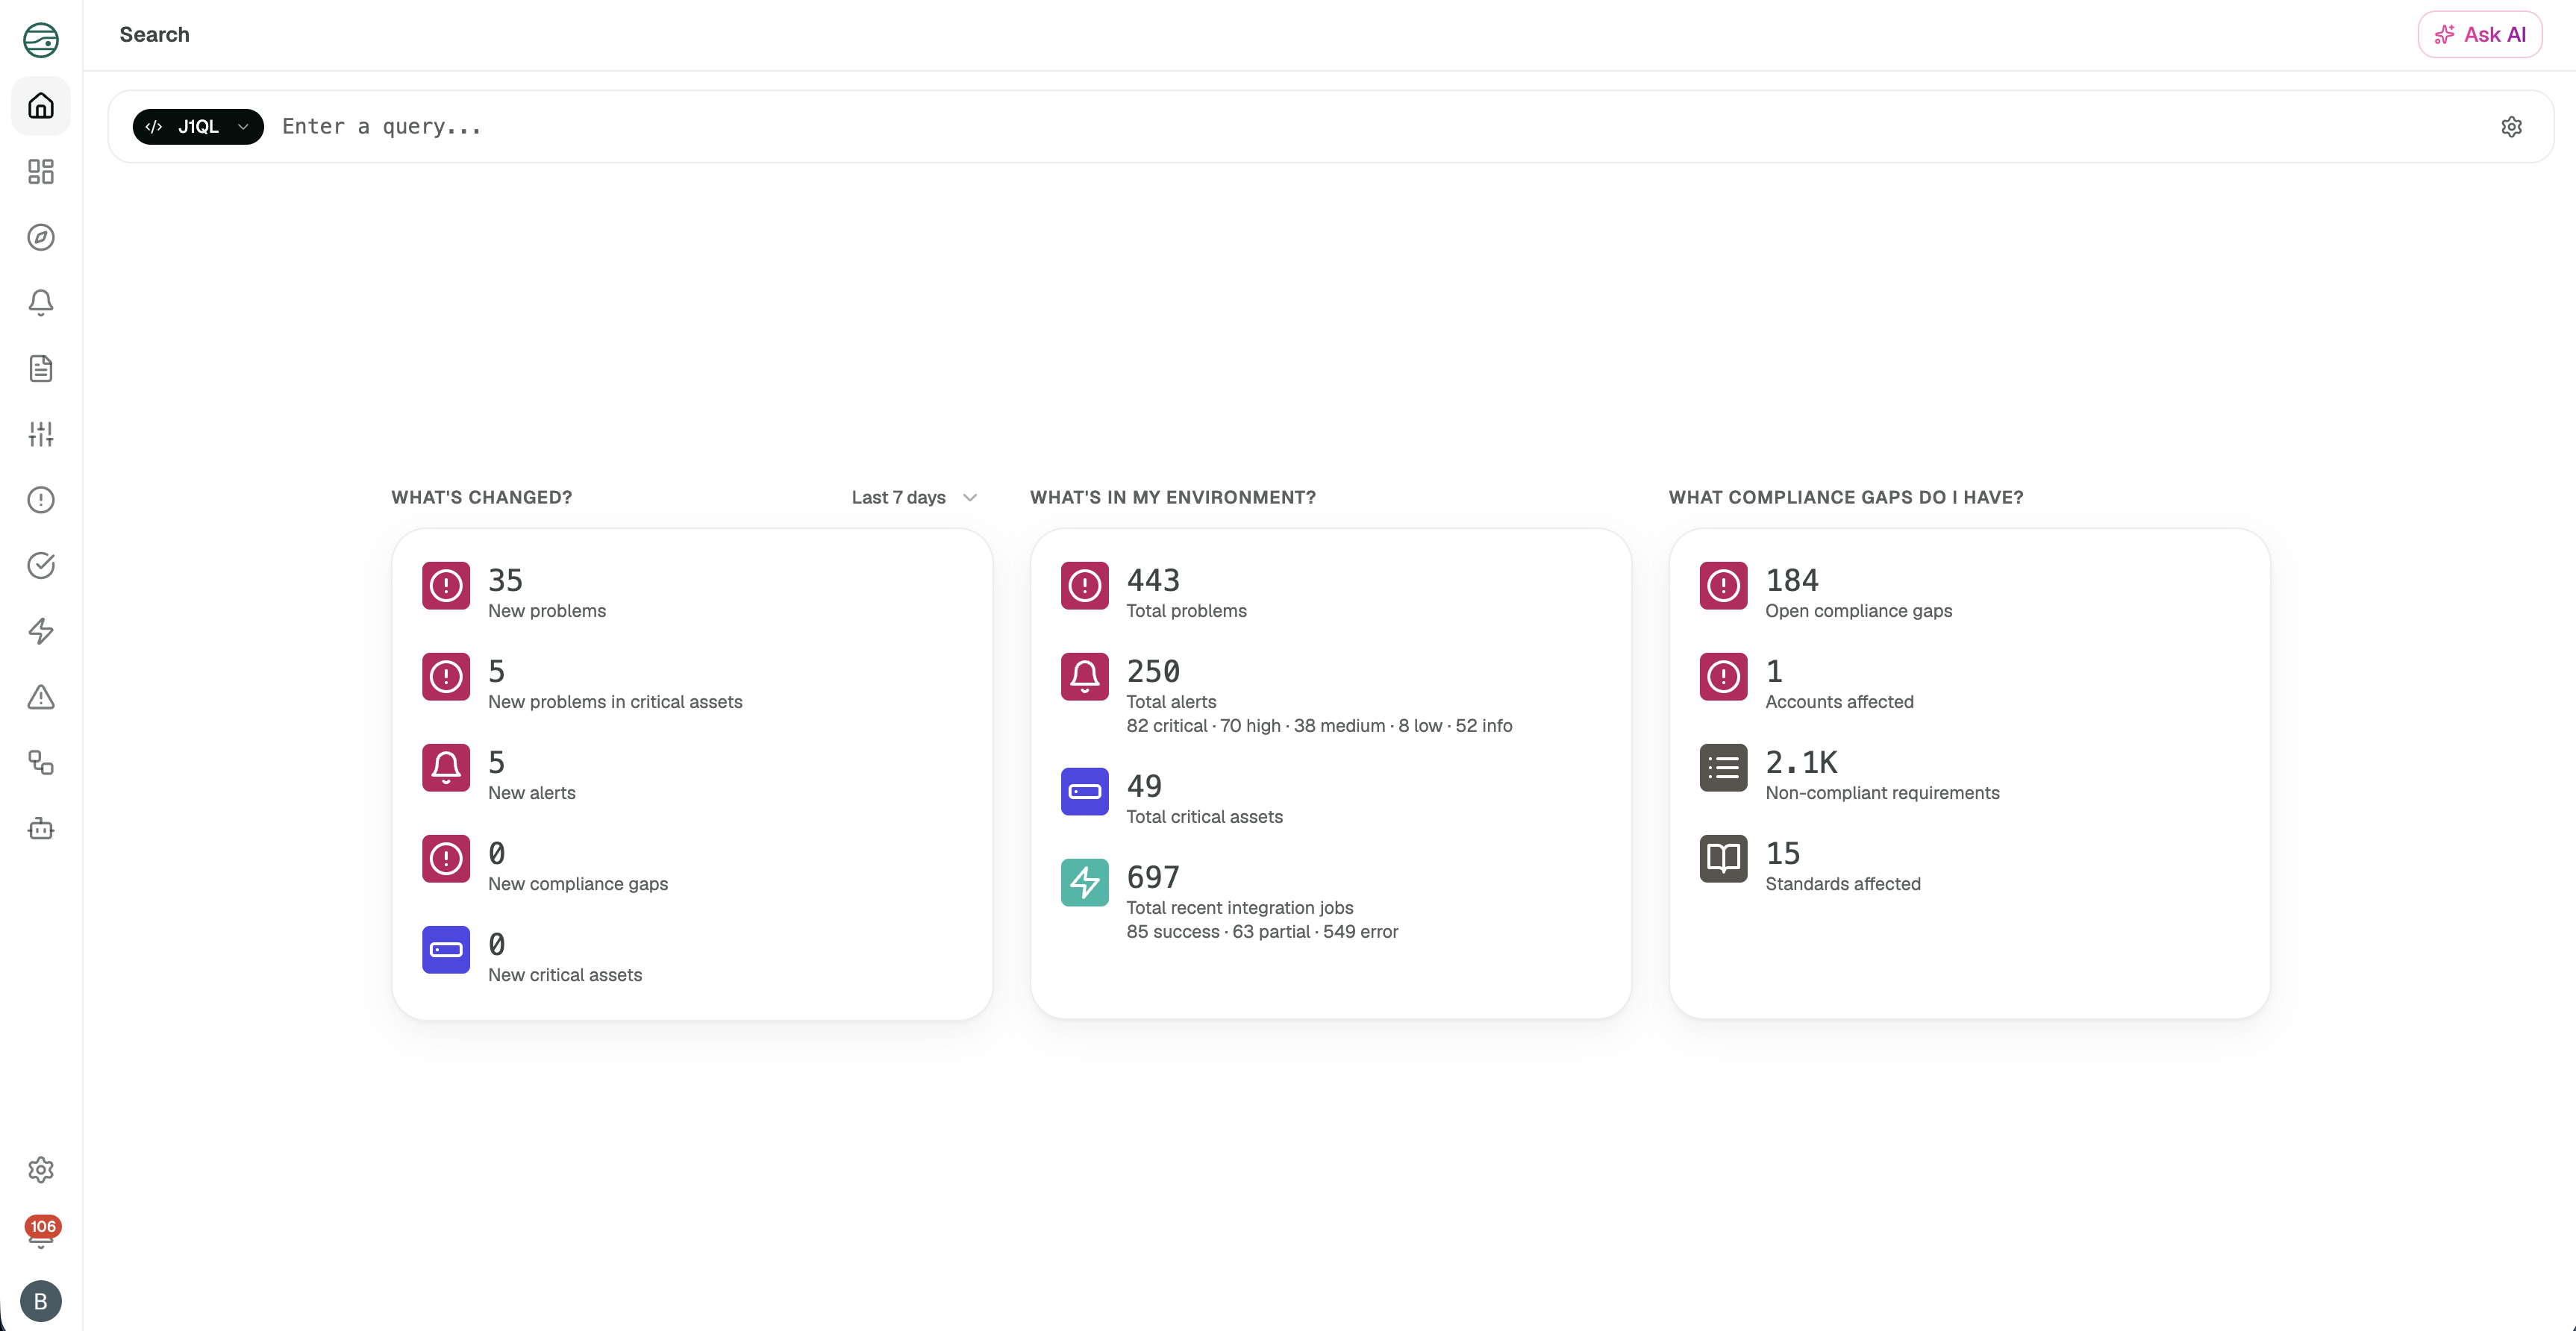
Dashboard Overview
- What's changed?: An overview breaking down the changes in your environment for a given time frame (last 7 days is the default). You can adjust the time frame from time of your last login up to 90 days.
- What's in my environment?: An aggregate view of the problems, alerts, and critical assets within your JupiterOne workspace.
- What compliance gaps for I have?: Showcases the running total of compliance gaps within your JupiterOne workspace.
Your initial overview page may or may not feature the sections above depending on your user access. For more information on access and user roles, see our documentation.
JupiterOne Graph
JupiterOne is built as a data-driven graph platform. The JupiterOne graph provides a deep, highly contextualized representation of your assets, their relationships, and metadata. By capturing this data in a graph, JupiterOne enables you to gain a much more accurate picture of your entire environment.
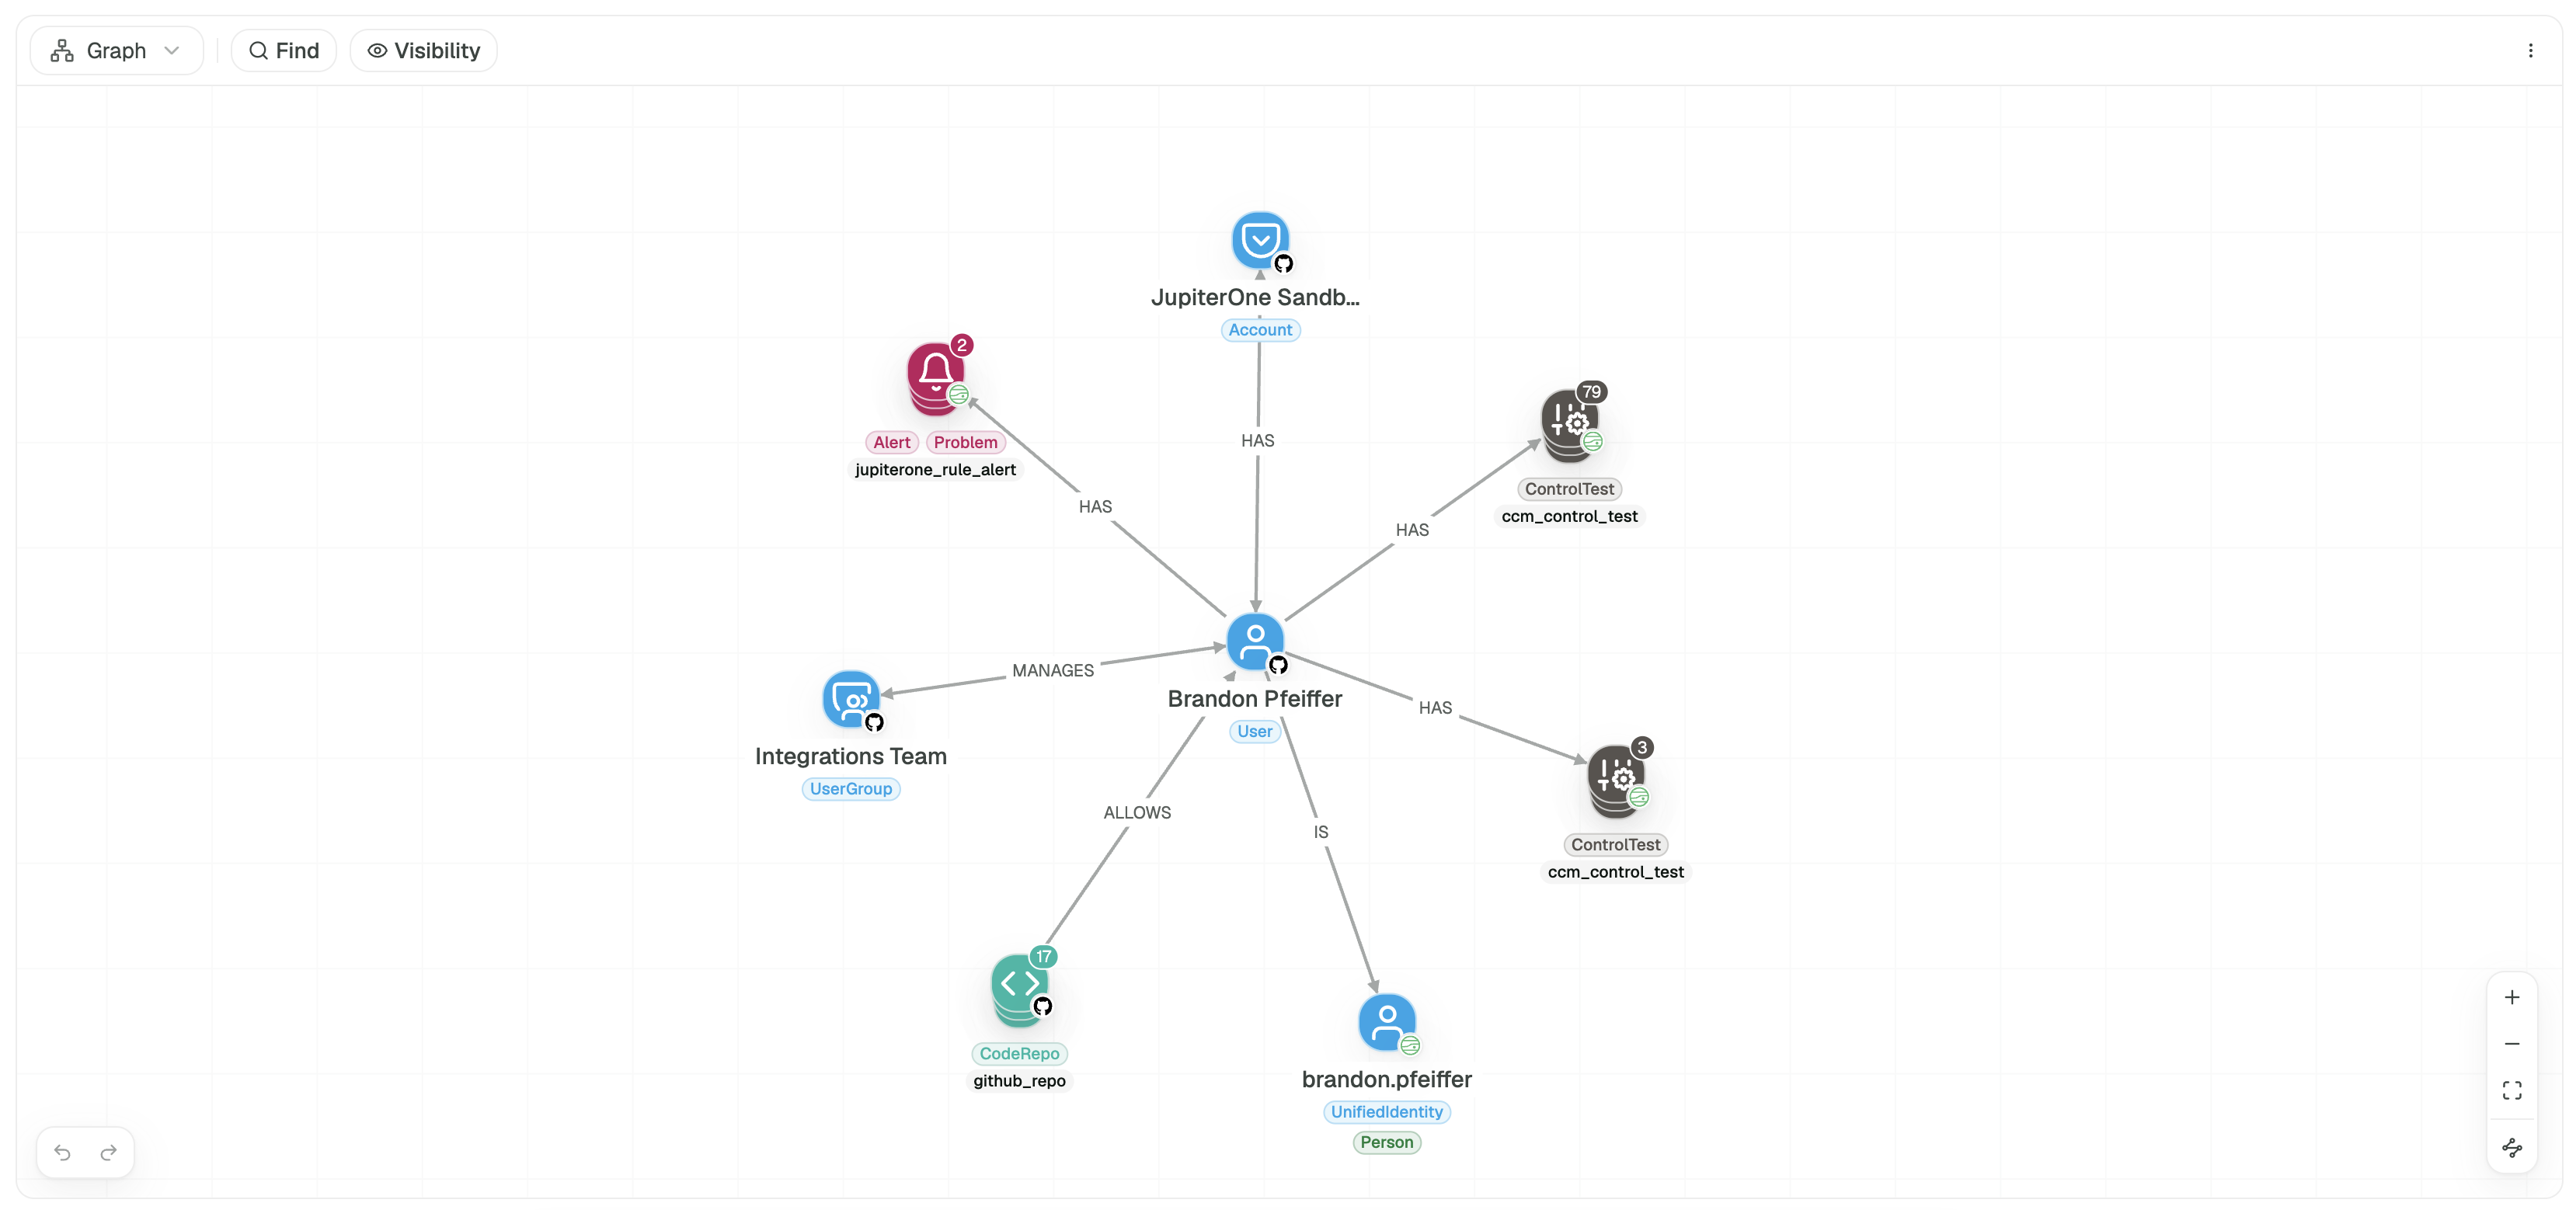
The graph allows for dialing in to particular assets to explore what and where a blast radius could pose a security threat.
Accessing the graph
You can access the JupiterOne graph from any query, simply change the view to Graph or add RETURN TREE to the end of the query.
Up Next
Now that you've explored the JupiterOne home view and graph, explore configuring your user settings, or if you're a workspace admin, configuring your workspace settings.