Unified Vulnerability Management
JupiterOne Unified Vulnerability Management (UVM) takes the raw output of every vulnerability scanner you run and turns it into a short list of remediation plans, routed to the right team. You see one row per vulnerability per asset across all sources, you prioritize using a risk score you control, and you act on plans rather than triaging a million findings.
UVM is also the system of record for what happens next. Every vulnerability on every asset carries a lifecycle state — open, awaiting verification, fixed, mitigated, exempted — tracked in one place across all of your scanners, verified against scanner evidence, and synchronized with Jira in both directions.
UVM is designed for security analysts who triage findings, security leaders who need a defensible prioritization model, and the service owners who actually apply the fixes.
Overview
Unified Vulnerability Management enables your team to:
- Deduplicate vulnerability findings across infrastructure scanners, cloud-native tools, and endpoint platforms into a single row per vulnerability per asset
- Prioritize using a transparent, layered risk score that combines technical impact and exploitation likelihood with asset context and control evidence, with a model and threshold you configure
- Group prioritized vulnerabilities into remediation plans that share a common fix, so your teams act on dozens of plans instead of thousands of CVEs
- Route cases to the team that owns the affected assets through organizational unit ownership, with AI-generated remediation context attached
- Track the lifecycle of every vulnerability per asset — claim fixes and have scanners verify them, record false positives, and see every state change on an attributed timeline
- Manage exemptions with expiry dates — accept risk or mark vulnerabilities non-exploitable with a justification, and review each exemption when it expires instead of losing track of it
- Synchronize with Jira in both directions — ticket closures propose lifecycle states in JupiterOne, and case progress writes back to the ticket
- Report remediation outcomes to leadership from an executive dashboard built on daily snapshots
- Ask the AI assistant to sort, filter, and navigate the UVM views in natural language
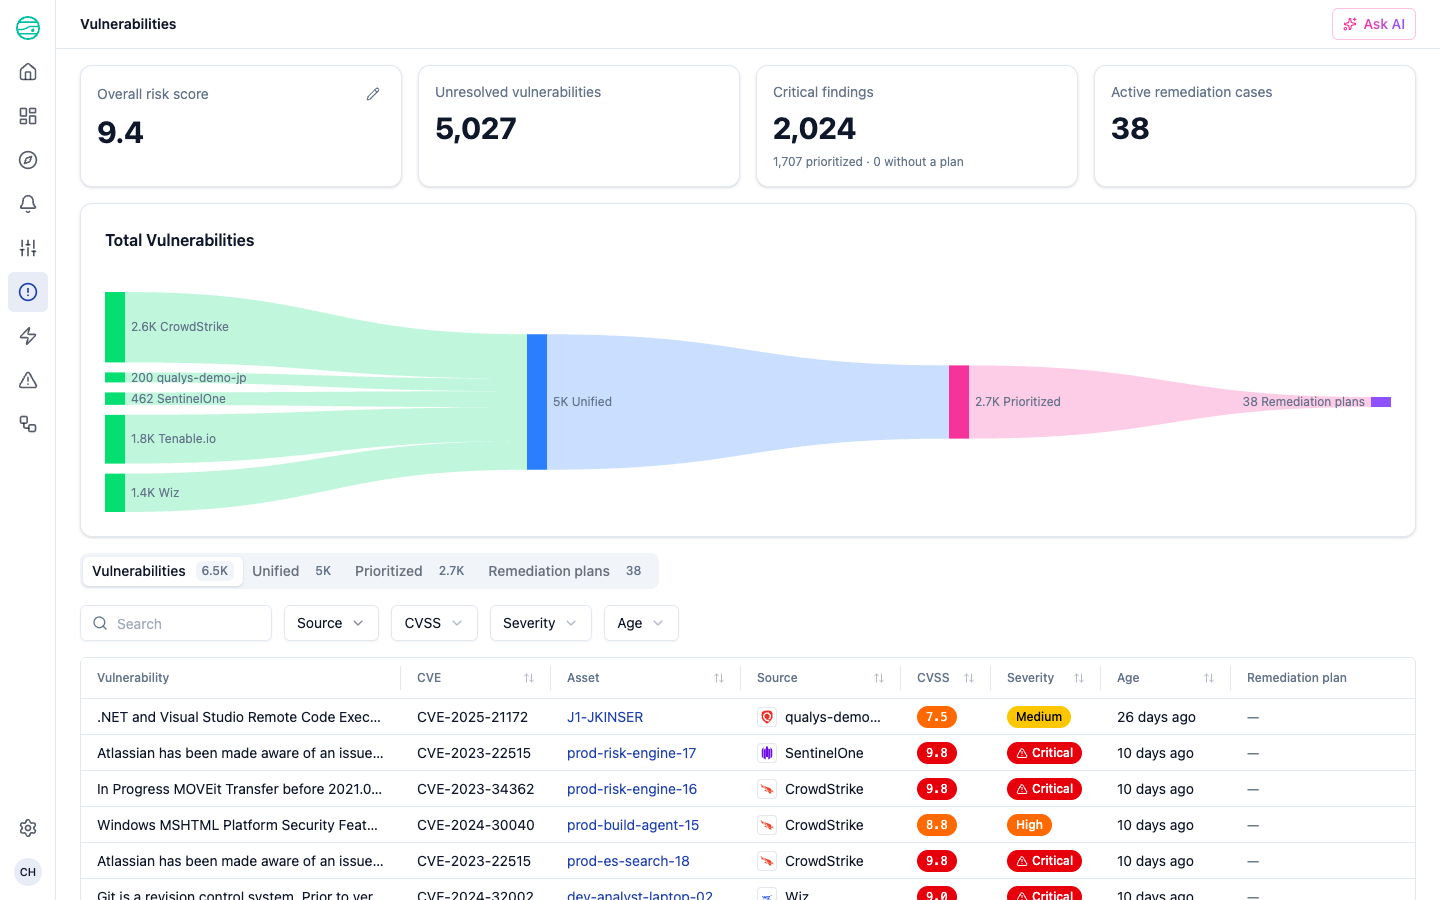
The summary header on every UVM page shows:
- Overall risk score — the average CVSS score across your prioritized vulnerabilities (0–10)
- Unresolved vulnerabilities — total deduplicated vulnerabilities still open
- Critical findings — count of critical-severity vulnerabilities, broken down by how many are prioritized and how many lack a plan
- Active remediation cases — count of cases currently routed to your service teams
The prioritization funnel
Every UVM view is a stage in a single funnel. You start with raw findings on the left and end with team-routed cases on the right. The Sankey diagram at the top of every UVM page shows the live shape of the funnel for your environment, including which scanners are contributing to each stage.
The four stages are:
| Stage | What it contains | What it answers |
|---|---|---|
| Source | Raw findings, one row per scanner per asset per CVE | Which vulnerabilities did each tool report? |
| Unified | Deduplicated vulnerabilities, one row per CVE per asset, with all reporting sources rolled up | What is the real, unique set of vulnerabilities I have? |
| Prioritized | Unified vulnerabilities whose risk score exceeds your configured threshold | Which vulnerabilities should I work on first? |
| Remediation plans | Prioritized vulnerabilities grouped by a common fix, routed to owning teams as cases | What is the smallest set of actions that addresses the most risk? |
Each stage is a tab in the UVM navigation. You can click any node in the Sankey diagram to filter the underlying table to that segment of the funnel.
Source vulnerabilities
The Source tab shows raw findings exactly as your scanners report them. One row exists for every (scanner, asset, CVE) tuple. This is the data ingestion layer of UVM — the same vulnerability seen by three scanners on one host appears as three rows here.
Use this view when you need to:
- Audit which scanner reported a specific finding
- Compare coverage between tools
- Investigate why a finding does or does not appear in the Unified view
Columns: Vulnerability, CVE, Asset, Source, CVSS, Source severity, Age, Remediation plan.
Filters: Source (scanner integration), CVSS range, Severity, Age. The Search field matches against CVE identifier, vulnerability title, and asset name.
The Source severity column shows severity exactly as the reporting scanner rated it. The Unified and Prioritized views show a normalized severity derived from CVSS, so the same finding can carry different severities in the Source view and the unified views.
The Remediation plan column links each finding to the plan that addresses it, when one exists. Findings without a plan show an em dash.
Unified vulnerabilities
The Unified tab is where deduplication happens. JupiterOne aligns vulnerability data from every configured scanner against a single ontology and collapses duplicate findings into one row per CVE per asset. The Sources column shows which scanners reported each finding.
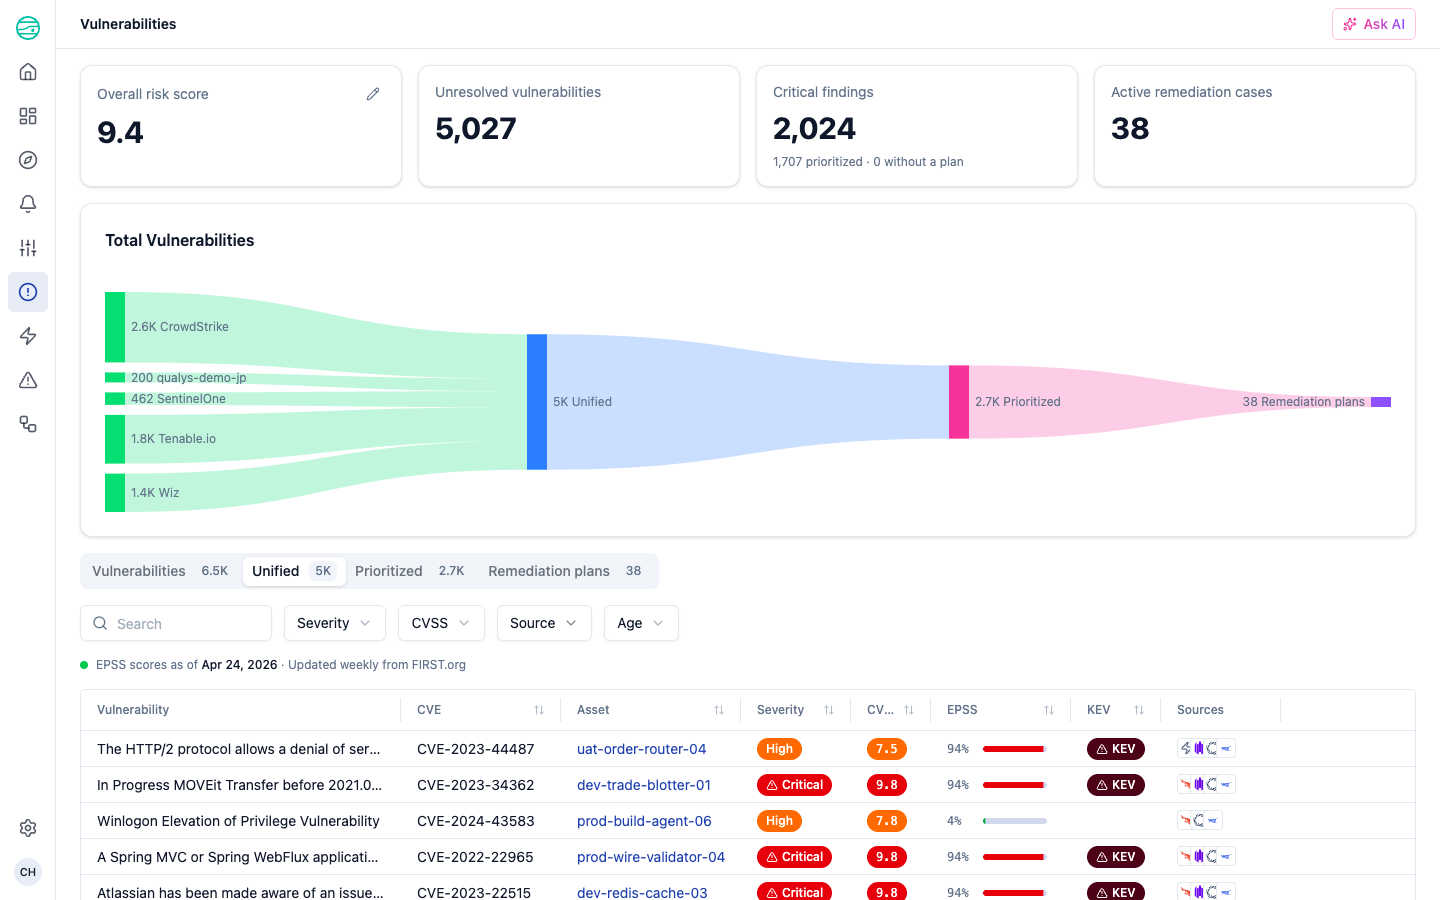
Columns: Vulnerability, CVE, Asset, Severity, CVSS, EPSS, KEV, Sources, State.
Filters: Severity, CVSS range, Source, Age, State.
The State column shows where each vulnerability stands in its lifecycle. By default the Unified and Prioritized views show your active work: vulnerabilities in closed states (Fixed, Mitigated, Accepted risk, Non-exploitable, and False positive) are hidden. Use the State filter to view them — closed vulnerabilities are archived by filter, not moved to a separate page.
EPSS and KEV
The Unified view enriches every CVE with:
- EPSS — The Exploit Prediction Scoring System probability, expressed as a percentage. This is the likelihood that the vulnerability will be exploited in the wild in the next 30 days, sourced from FIRST.org and updated weekly. The exact data refresh date is shown above the table.
- KEV — A chip indicating that the CVE appears in CISA's Known Exploited Vulnerabilities catalog. KEV CVEs have confirmed in-the-wild exploitation.
Sort by EPSS descending to see the vulnerabilities most likely to be exploited soon. Combine the KEV filter with the Severity = Critical filter for a focused view of CVEs that are both severe and actively exploited.
Source attribution
Each row shows a chip for every scanner that reported the underlying finding. A CVE seen by CrowdStrike, SentinelOne, Tenable, and Wiz on the same host appears as one row in this view with four source chips. Click any row to inspect the underlying raw findings.
UVM ships with first-class support for the following scanner integrations:
- CrowdStrike Falcon
- Qualys VMDR
- SentinelOne
- Tenable.io
- Wiz
Findings from Software Bill of Materials (SBOM) ingestion also appear as a source chip on affected assets.
Prioritized vulnerabilities
The Prioritized tab shows the subset of unified vulnerabilities whose risk score exceeds the prioritization threshold you have configured. This is the working list for your security analyst.
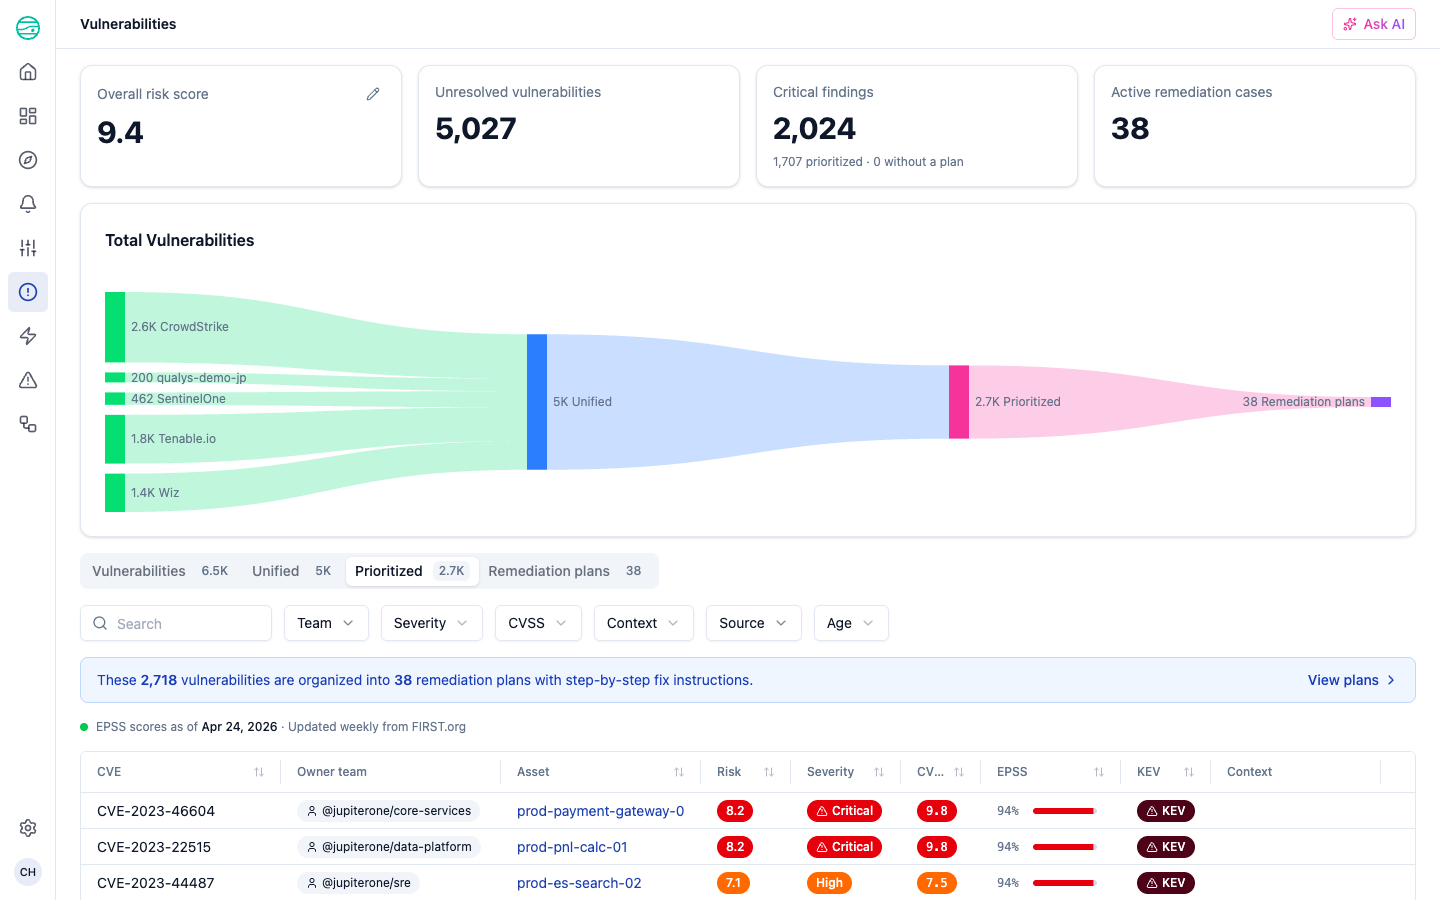
Columns: CVE, Owner team, Asset, Risk, Severity, CVSS, EPSS, KEV, Context.
Filters: Team, Severity, CVSS, Context, Source, Age.
What "prioritized" means
A vulnerability is prioritized when its Risk score meets the prioritization threshold — 90% by default. The Risk column shows scores on a 0–10 scale, so with the default threshold a vulnerability needs a score of at least 9.0 to appear here. You can adjust the scoring model and the threshold from the Risk configuration panel.
Owner team
The Owner team column shows which organizational unit (OU) owns the affected asset. This drives where the case is routed when a remediation plan is created. OUs are configured once and shared across JupiterOne — see Organizational Units for how OUs are derived, how to set owner and routing metadata, and how to filter by OU.
Context
The Context column surfaces asset-level signals that influenced the risk score, including the asset's criticality level and whether it is reachable from the public internet.
Remediation plans
The Remediation plans tab is where your team takes action. A plan groups multiple prioritized vulnerabilities that share a common fix — for example, all CVEs resolved by patching Apache ActiveMQ to 5.18.3.
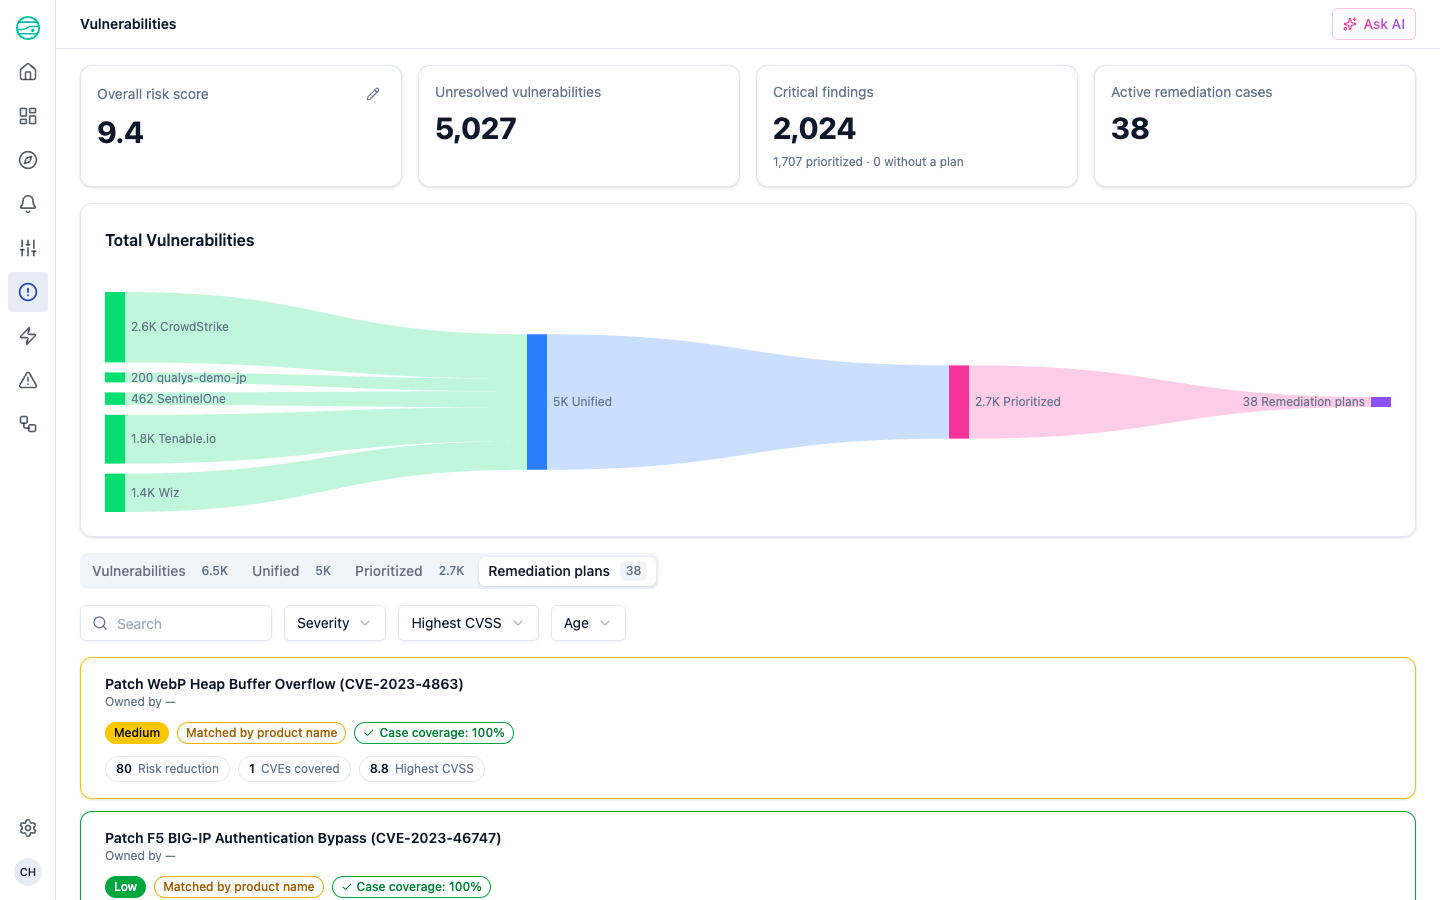
Each plan card shows:
- Title — A descriptive action statement (for example, "Upgrade Apache ActiveMQ to 5.18.3+ or 5.17.6+")
- Owner team — The organizational unit responsible for the plan, or an em dash if no owner is assigned
- Severity — The highest severity across the plan's CVEs
- Matched by product name — How the plan was grouped. UVM groups vulnerabilities by Common Platform Enumeration (CPE), using the product name resolved from each finding.
- Case coverage — Percentage of affected assets covered by a routable case
- Risk reduction — The total risk score reduction your environment achieves when this plan is completed
- CVEs covered — Number of unique CVEs addressed by this plan
- Highest CVSS — The most severe CVSS score among the plan's CVEs
Filters: Severity, CVSS (sortable by Highest CVSS), Age.
Each plan card also lists its cases with their derived status. Use the By plan / By case pivot to switch the tab between plan cards and a flat list of cases, filterable by team and case status.
Plan detail
Click any plan card to open the plan detail panel.
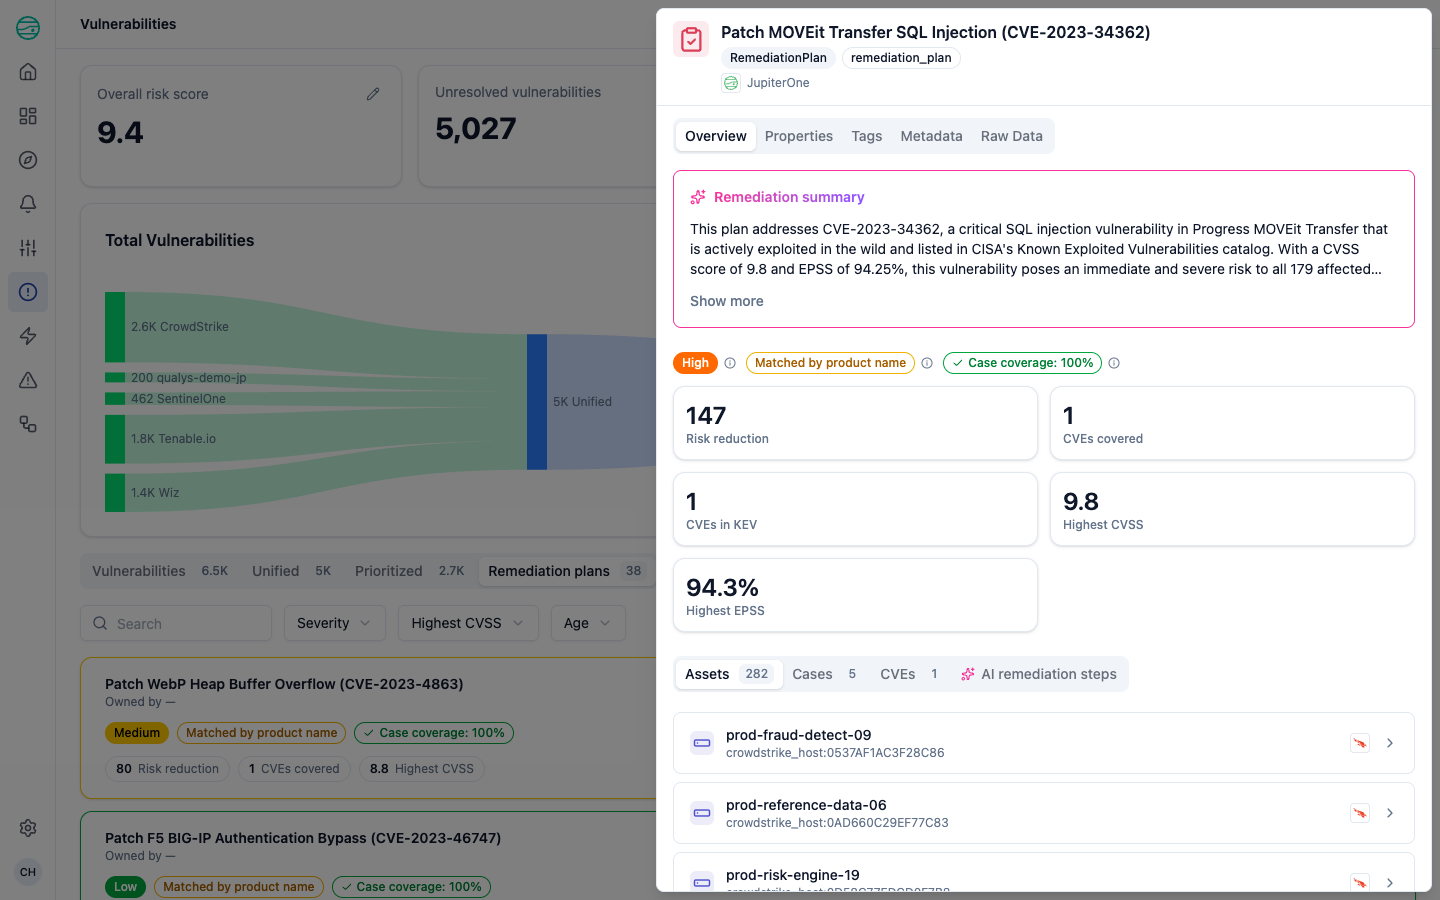
The plan detail panel provides:
- Remediation summary — An AI-generated description of the vulnerability, its impact, and why the plan should be prioritized
- Plan metrics — Risk reduction, CVEs covered, CVEs in KEV, Highest CVSS, Highest EPSS
- Stat tabs — Counts and lists for Assets, Cases, and CVEs included in the plan
- AI remediation steps — Step-by-step fix instructions generated for this specific plan
- Properties, Tags, Metadata, and Raw Data tabs for the underlying graph entity
The plan persists as a graph entity in your JupiterOne account, so you can query plans with J1QL alongside the rest of your asset data.
AI Assistant
The Ask AI button in the UVM header opens the AI Assistant sidebar. The assistant operates on the current UVM view and helps you sort, filter, and navigate without writing queries.
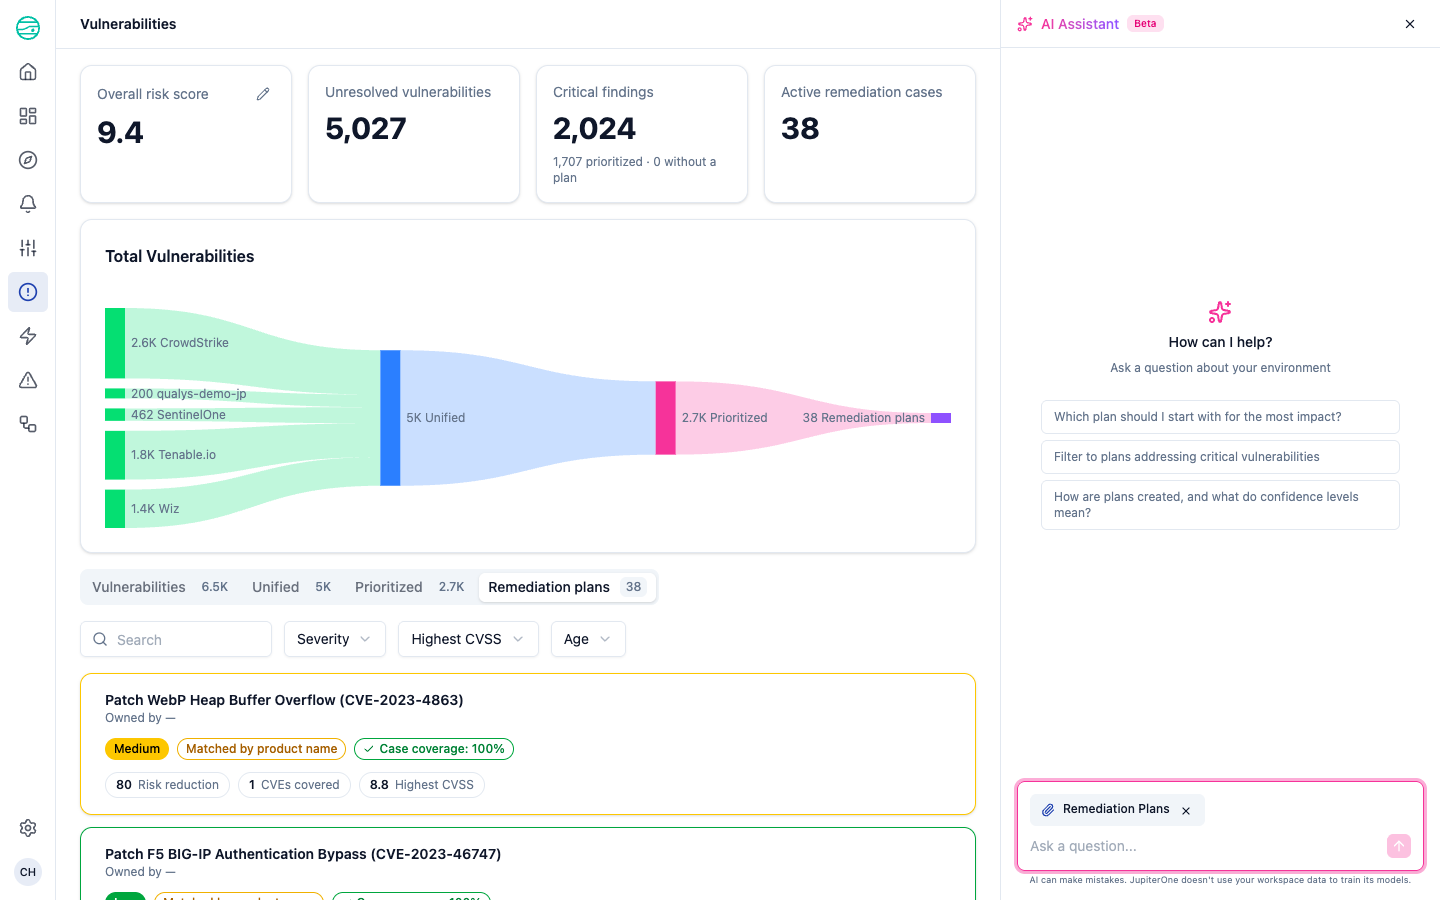
The assistant supports natural-language commands such as:
- "Sort by EPSS descending"
- "Filter to plans addressing critical vulnerabilities"
- "Which plan should I start with for the most impact?"
- "How are plans created, and what do confidence levels mean?"
When the assistant references a specific entity in its response, click the reference to open the entity inspector with full context.
The AI Assistant is in beta. Responses can occasionally be incorrect, and very large contexts can slow the response. JupiterOne does not use your workspace data to train its models.
Getting started
Step 1: Confirm your scanner integrations are configured
UVM aggregates findings from your configured integrations. From Integrations, confirm that at least one of the following is configured and syncing:
- CrowdStrike Falcon
- Qualys VMDR
- SentinelOne
- Tenable.io
- Wiz
You can see how many findings each scanner is contributing by hovering any source node in the Sankey diagram on the UVM landing page.
Step 2: Set up asset criticality
Asset criticality is a major lever in the risk score. To make sure your most important assets surface near the top of the Prioritized view:
- Navigate to Assets > Asset criticality
- Select Set up for me to have the agent propose criticality levels and the queries that fill them, or Start from our policy to build them from your classification policy
- Review the proposal, then click Preview changes and Apply setup
Your levels apply on the next hourly run. See Asset criticality for the full setup and review flow.
Step 3: Set your scoring model and prioritization threshold
- Open the Risk configuration panel by selecting the edit (pencil) icon on the Overall risk score card
- Review the layered scoring defaults: the threat blend of technical impact and exploitation likelihood, the KEV floor, and the context multipliers for your asset criticality levels and publicly exposed assets
- Adjust the model to match your organization's risk priorities. For example, raise the multipliers for your most critical levels if asset criticality should dominate, or enable the controls layer once your CCM controls carry MITRE ATT&CK technique mappings.
- Set the Prioritization threshold. A lower threshold widens the Prioritized view; a higher threshold tightens it.
- Click Apply changes
Step 4: Confirm case routing is configured
- From the Risk configuration panel, select the Cases — Ownership assignment namespace you use for team routing
- Confirm each organizational unit in that namespace has an owner email and ticketing workflow configured
- Open the Plans tab and confirm that plans show owner teams (rather than em dashes) on the cards you intend to route
Step 5: Configure the Jira status mapping
- For each Jira project and issue type you route cases to, map case statuses to Jira statuses and resolutions, and Jira resolutions to lifecycle states
- Verify each mapping with one test round trip — see Configure the status mapping for why this step matters
- Confirm the analysts who will manage the lifecycle have graph-write permission — state transitions require it
Step 6: Create your first tickets
- Open the Plans tab and sort by Highest CVSS or Risk reduction
- Open the highest-priority plan
- Review the AI-generated remediation summary and steps
- Confirm the affected assets and the owning teams
- Create tickets for the plan's cases — UVM has already partitioned the assets by owning team, one case per team
Step 7: Adopt the lifecycle
- Have remediation owners select Mark remediated after applying a fix (or close the Jira ticket as Patched) so every fix goes through verification
- Record risk acceptances and false positives as lifecycle states with justifications, instead of closing tickets around them
- Make the Inbox part of your team's weekly routine — verification confirmations, expiring exemptions, and ticket disagreements all wait there
Step 8: Monitor progress
- The Active remediation cases count on the summary header tracks open cases
- The Critical findings card shows how many critical-severity vulnerabilities lack a plan
- Open the Plans tab regularly to review case coverage and apply new plans as new vulnerabilities surface
- Open the Executive dashboard to baseline time to remediate, reopens by fix confidence, and accepted risk once your first snapshots accrue
Best practices
Start narrow, then widen
Begin with the default risk configuration and a small top criticality level. Work through the top-of-funnel plans for those assets before widening your most critical levels or lowering the prioritization threshold. This produces a manageable Prioritized list and gives your team a clear early win.
Use plans, not individual findings
The Plans view is the right working list for most teams. A plan represents the smallest action that addresses the most risk, and one case routed to one team replaces dozens of duplicate tickets across owners. Investigate individual findings only when a plan is unclear or when you need to audit a specific scanner result.
Tune the model, not the threshold
The fastest way to change which vulnerabilities surface as prioritized is to adjust the scoring model, not the threshold. Raising the exploitation likelihood weight in the threat layer favors in-the-wild exploitation; raising the multipliers for your most critical levels favors business-critical assets. The threshold should change only when you want to widen or tighten the size of the Prioritized view.
Watch the Sankey diagram
The Sankey diagram at the top of every UVM page is your fastest signal that something is wrong upstream. Sudden drops in source contributions, missing scanners, or unusually wide gaps between Unified and Prioritized stages usually point to integration or configuration issues rather than vulnerability changes.
Claim fixes so they verify
Prefer Mark remediated (or closing the ticket as Patched) over Mark fixed. Claimed fixes come back scanner-confirmed; closes without a standing claim are recorded as assumed, and any fixed vulnerability that genuinely disappeared and then returns reopens automatically. The Reopens by fix confidence panel on the executive dashboard will show you which habit your team has.
Record exemptions in JupiterOne, not in tickets
When a vulnerability will not be remediated (accepted risk, non-exploitable, false positive), record it as a lifecycle state with its justification rather than closing a ticket around it. Exemptions in JupiterOne carry an approver and an expiry date, survive rescans, and come back for review when they lapse — a note in a closed ticket does none of that.
Work the Inbox, not the whole list
The Inbox holds everything that actually needs a human decision: fixes ready to confirm, claims that did not hold, exemptions coming due, and ticket disagreements. A short weekly pass through the Inbox keeps the lifecycle honest without anyone re-triaging the full vulnerability list.